Scraping Yahoo Finance Data & Conducting Time Series Analysis with R (R Studio) - A Meetup event I organized in 2023
news
code
analysis
Author
Jimmy Xu
Published
October 25, 2022
In today’s fast-paced and data-driven world, it’s crucial for businesses and individuals to make informed decisions based on reliable and up-to-date information. One way to obtain such information is by web scraping financial data from sources like Yahoo Finance and Google Trends, and conducting time series analysis to reveal insights and patterns that could be useful for decision-making.
In this tutorial, we will explore the process of scraping financial data from Yahoo Finance and Google Trends using R and R Studio. We will begin by discussing the importance of web scraping in financial analysis and how it can be used to extract relevant data from the web. We will then move on to the specifics of scraping Yahoo Finance and Google Trends data and discuss the steps involved in presenting the results using plots.
We will walk through a step-by-step approach, starting with the installation of the necessary R packages and libraries required for web scraping and data visualization. Next, we will demonstrate how to extract data from Yahoo Finance and Google Trends using R and R Studio, and how to clean, format and process the extracted data to present the results.
The quantmod package in R is a powerful tool for financial quantitative modeling and analysis. Here are some short syntax examples to get you started:
library(quantmod)
Loading required package: xts
Loading required package: zoo
Attaching package: 'zoo'
The following objects are masked from 'package:base':

    as.Date, as.Date.numeric
Loading required package: TTR
Registered S3 method overwritten by 'quantmod':
  method            from
  as.zoo.data.frame zoo
library(lubridate)
Attaching package: 'lubridate'
The following objects are masked from 'package:base':

    date, intersect, setdiff, union
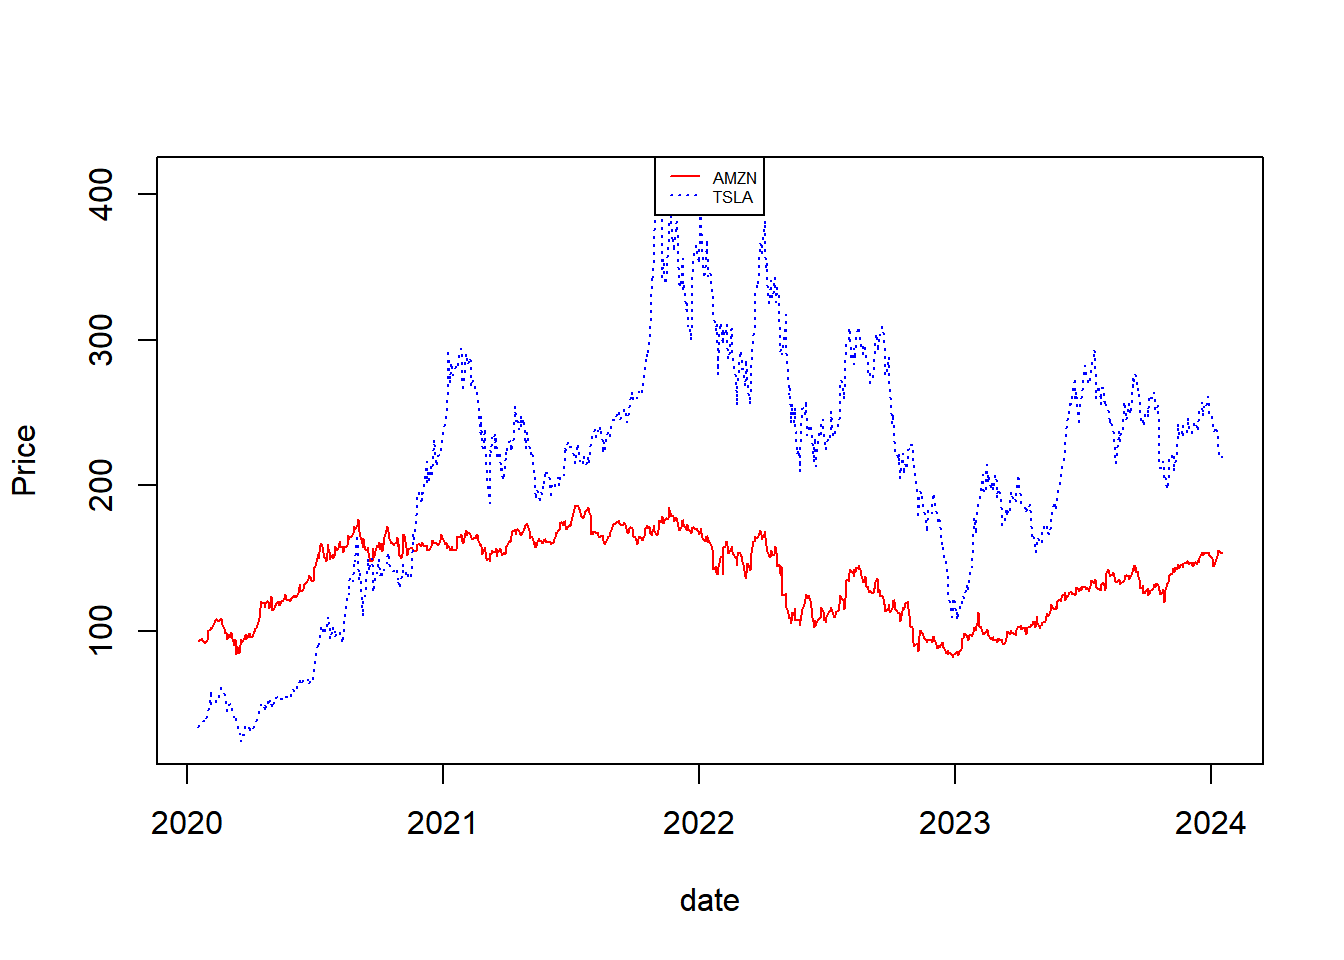
getSymbols('AMZN', src ='yahoo', from =Sys.Date() -years(4), to =Sys.Date())
[1] "AMZN"
getSymbols('TSLA', src ='yahoo', from =Sys.Date() -years(4), to =Sys.Date())
These are just basic examples. The quantmod package offers a wide range of functions for financial modeling, technical analysis, and strategy development. Explore the documentation for more advanced usage.